
It's not about the language. Discover a new way of visualizing your tech skills.
Visualize your team's skills instantly.
Discover a consolidated collective view based on the different software engineering skills of each member.
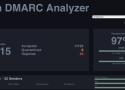
Open DMARC Analyzer is an Open Source DMARC Report Analyzer to be used with DMARC reports that have been parsed by John Levine's rrdmarc script or techsneeze's dmarcts-report-parser.
Open source DMARC report analyzer and visualizer
statistical data visualization.
Seaborn is a Python data visualization library based on matplotlib. It provides a high-level interface for drawing attractive and informative statistical graphics.
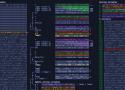
Sha256 algorithm explained online step by step visually.
Sha256 algorithm explained online step by step visually sha256algorithm.com This website will help you understand how a sha256 hash is calculated from start to finish.
3D DOM viewer, copy-paste this into your console to visualise the DOM topographically.

The CNCF candidate for observability visualisation. Already supports Prometheus - more data sources to come!
It aims to become a standard dashboard visualization tool for Prometheus and other datasources. It will focus on being GitOps-compatible and thus enabling a smooth "dashboards as code" workflow via a new and well-defined dashboard definition model.
Charts.css is an open source CSS framework for data visualization.
Visualization help end-users understand data. Charts.css help frontend developers turn data into beautiful charts and graphs using simple CSS classes.

pscircle visualizes Linux processes in a form of radial tree.
This new edition depicts 529 cable systems and 1,444 landings that are currently active or under construction.
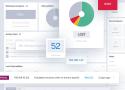
Protect your business, scale your security. Open Source Vulnerability Management Platform.
Security has two difficult tasks: designing smart ways of getting new information, and keeping track of findings to improve remediation efforts. With Faraday, you may focus on discovering vulnerabilities while we help you with the rest. Just use it in your terminal and get your work organized on the run. Faraday was made to let you take advantage of the available tools in the community in a truly multiuser way.
Faraday aggregates and normalizes the data you load, allowing exploring it into different visualizations that are useful to managers and analysts alike.
Folium builds on the data wrangling strengths of the Python ecosystem and the mapping strengths of the Leaflet.js library. Manipulate your data in Python, then visualize it in a Leaflet map via Folium.
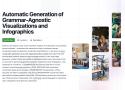
Automatic Generation of Visualizations and Infographics with LLMs.
LIDA is a library for generating data visualizations and data-faithful infographics. LIDA is grammar agnostic (will work with any programming language and visualization libraries e.g. matplotlib, seaborn, altair, d3 etc) and works with multiple large language model providers (OpenAI, PaLM, Cohere, Huggingface). Details on the components of LIDA are described in the paper here and in this tutorial notebook. See the project page here for updates!.

Kiri is a visual tool designed for reviewing schematics and layouts of KiCad projects that are version-controlled with Git.

Track C2 over time by framework and location.
C2Live is an open-source project aimed at providing a comprehensive and interactive platform for tracking Command and Control (C2) malicious IP addresses over time.
audio waveform player JavaScript library.
Wavesurfer.js is an open-source audio visualization library for creating interactive, customizable waveforms.
Data Mining, Fruitful and Fun
Open source machine learning and data visualization.
Build data analysis workflows visually, with a large, diverse toolbox.
Discrete color palettes (hundreds of them!) for JavaScript.
Open-source low-code web application framework. Create full websites writing only simple database queries.
SQLpage is an SQL-only webapp builder. It is meant for data scientists, analysts, and business intelligence teams to build powerful data-centric applications quickly, without worrying about any of the traditional web programming languages and concepts.
With SQLPage, you write simple .sql files containing queries to your database to select, group, update, insert, and delete your data, and you get good-looking clean webpages displaying your data as text, lists, grids, plots, and forms.
Mine, merge, and map data for novel insights.
Open Source Intelligence. Fetch data from different sources and returns the results as visual entities that you can explore step-by-step.