
 email
email
The OpenTelemetry Collector offers a vendor-agnostic implementation on how to receive, process and export telemetry data. In addition, it removes the need to run, operate and maintain multiple agents/collectors in order to support open-source telemetry data formats (e.g. Jaeger, Prometheus, etc.) to multiple open-source or commercial back-ends.
OpenTelemetry-native GenAI and LLM Application Observability.
Open source platform for AI Engineering: OpenTelemetry-native LLM Observability, GPU Monitoring, Guardrails, Evaluations, Prompt Management, Vault, Playground. 
 Integrates with 50+ LLM Providers, VectorDBs, Agent Frameworks and GPUs.
Open-source observability for your LLM application, based on OpenTelemetry.
OpenLLMetry is a set of extensions built on top of OpenTelemetry that gives you complete observability over your LLM application. Because it uses OpenTelemetry under the hood, it can be connected to your existing observability solutions - Datadog, Honeycomb, and others.
Open Source Metrics Engine.
Distributed TSDB and Query Engine, Prometheus Sidecar, Metrics Aggregator, and more such as Graphite storage and query engine.
M3 is a Prometheus compatible, easy to adopt metrics engine that provides visibility for some of the world’s largest brands.

Tools to measure and visualize energy use on desktop computers.

Prometheus Exporter for Cloud Provider agnostic cost metrics.
Cloud Cost exporter is a designed to collect cost data from cloud providers and export the data in Prometheus format. The cost data can then be combined with usage data from tools such as stackdriver, yace, and promitor to measure the spend of resources at a granular level.

Postgres performance at any scale. PostgreSQL Tuning
Deliver consistent database performance and availability through intelligent tuning advisors and continuous database profiling.

SBOM quality score - Quality metrics for your sboms.
sbomqs is your primary tool to assess an SBOM's quality and compliance. The higher the score the more consumable & compliant your SBOMs are.

Affordable full-stack production debugging & monitoring. Resolve Production Issues, Fast.
An Open Source Observability Platform: Unify Session Replays, Logs, Traces, Metrics and Errors – All Without the Datadog Price Tag.
Resolve production issues, fast. An open source observability platform unifying session replays, logs, metrics, traces and errors powered by Clickhouse and OpenTelemetry.
Observability tools for modern infrastructures.
Centralized Blackbox health checks configuration and a Prometheus push gateway alternative.


 Energy consumption metrology agent. Let "scaph" dive and bring back the metrics that will help you make your systems and applications more sustainable !
Scaphandre [skafɑ̃dʁ] is a metrology agent dedicated to electric power and energy consumption metrics. The goal of the project is to permit to any company or individual to measure the power consumption of its tech services and get this data in a convenient form, sending it through any monitoring or data analysis toolchain.
Related contents:
The Most Advanced Time Series Platform.
Warp 10 is a modular open source platform shaped for the IoT that collects, stores and allows you to analyze sensor data. It offers both a Time Series Database and a powerful analysis environment that can be used together or independently.
concise commandline monitoring for containers.Top-like interface for container metrics.
ctop provides a concise and condensed overview of real-time metrics for multiple containers.
Related contents:
Grafana Agent is a vendor-neutral, batteries-included telemetry collector with configuration inspired by Terraform. It is designed to be flexible, performant, and compatible with multiple ecosystems such as Prometheus and OpenTelemetry.
Evolving the Prometheus exposition format into a standard.
OpenMetrics a specification built upon and carefully extending Prometheus exposition format in almost 100% backwards-compatible ways.
IP accounting iconoclasm.
pmacct is a small set of multi-purpose passive network monitoring tools. It can account, classify, aggregate, replicate and export forwarding-plane data, ie. IPv4 and IPv6 traffic; collect and correlate control-plane data via BGP and BMP; collect and correlate RPKI data; collect infrastructure data via Streaming Telemetry. Each component works both as a standalone daemon and as a thread of execution for correlation purposes (ie. enrich NetFlow with BGP data).
Telegraf is the open source server agent to help you collect metrics from your stacks, sensors, and systems.
Telegraf is a server-based agent for collecting and sending all metrics and events from databases, systems, and IoT sensors. Telegraf is written in Go and compiles into a single binary with no external dependencies, and requires a very minimal memory footprint.
Fast SQL for time-series
QuestDB is an open-source time-series database for high throughput ingestion and fast SQL queries with operational simplicity. It supports schema-agnostic ingestion using the InfluxDB line protocol, PostgreSQL wire protocol, and a REST API for bulk imports and exports.
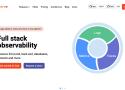
Open Source Observability Platform for Logs, Metrics, Traces, and More – Your Ultimate Dashboard for Alerts and Insights.
OpenObserve is a cloud native observability platform built specifically for logs, metrics, traces and analytics designed to work at petabyte scale.
Fluent Bit is a super fast, lightweight, and highly scalable logging and metrics processor and forwarder. It is the preferred choice for cloud and containerized environments.